
Physical Therapy
Help make patient goals a reality
Join a high-demand healthcare profession dedicated to helping people achieve their health goals and regain independence.
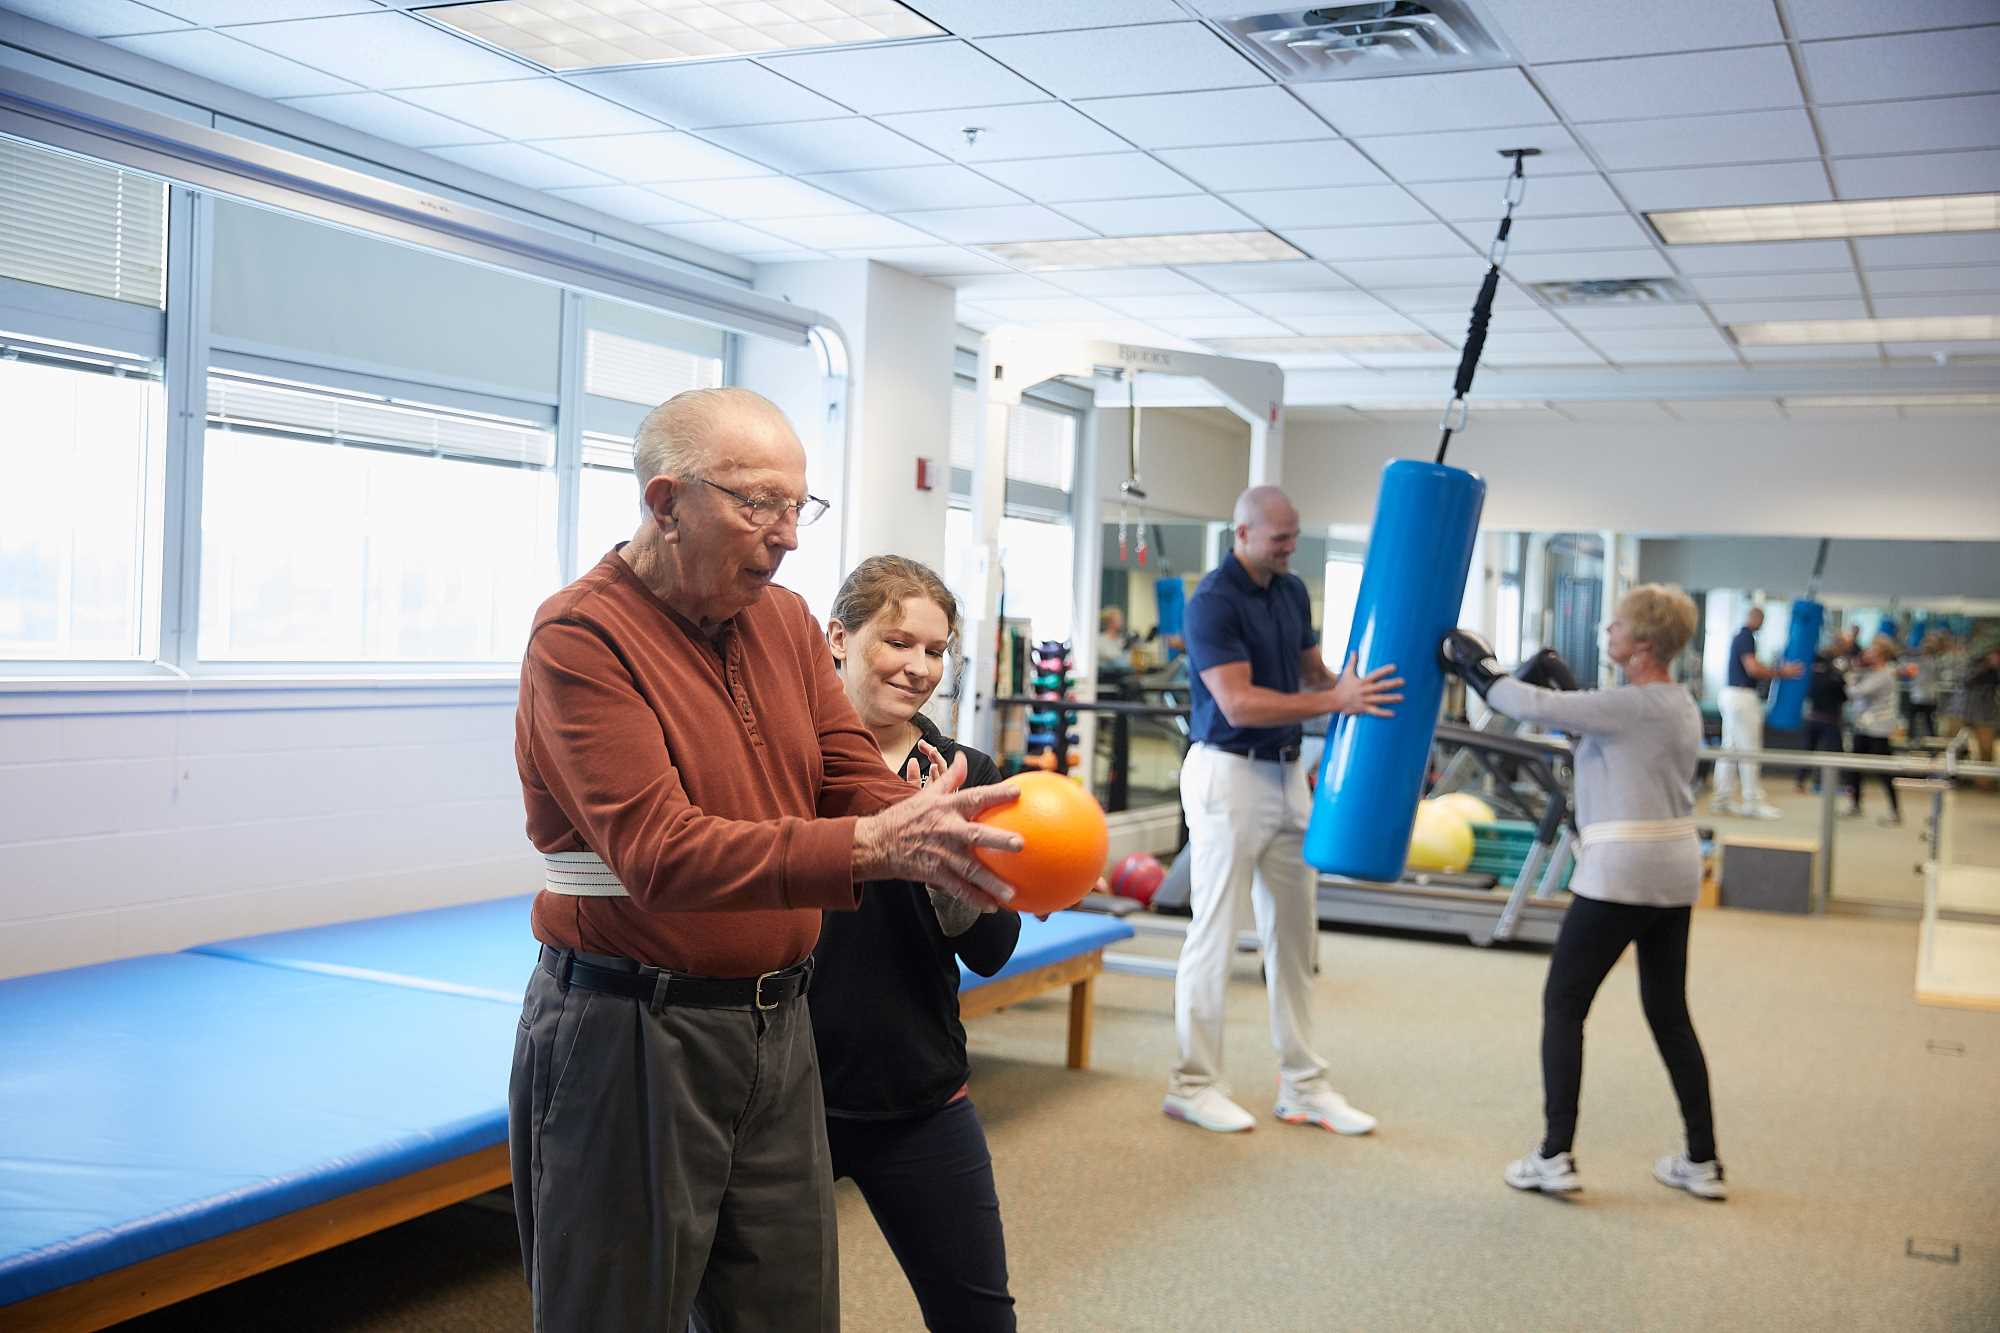
Physical therapists are movement experts who guide patients through recovery from injury, illness or surgery. Whether supporting someone as they take their first steps after an operation or helping an athlete return to peak performance, physical therapists reduce pain, restore mobility and rebuild strength. They also empower patients and families with the knowledge and exercises needed to continue progress at home.
UWL’s nationally accredited Doctor of Physical Therapy (DPT) program blends rigorous academics with immersive, hands-on clinical experiences. With small class sizes, exceptional faculty mentorship and a strong record of graduate success, our program prepares you to enter the profession confident, skilled and ready to make a meaningful impact.
Program at a glance
- Format: Full-time, In-person
- Commitment: 34 months
- Program start: Summer
- Credits: 111
Career outlook
Why choose UWL’s physical therapy program?
UWL's Doctor of Physical Therapy Program is accredited by the Commission on Accreditation in Physical Therapy Education (CAPTE). Review our program profile for more information.
UWL’s program offers exceptional value. Students benefit from small class sizes, extensive hands-on learning, and outstanding outcomes — including 100% pass rates on national licensure exams and excellent job placement — all at a cost that is significantly lower than many comparable programs nationwide.
Our graduates consistently excel on the National Physical Therapy Examination (NPTE). The 2025 first-time pass rate was 100%, reflecting both faculty expertise and our students’ preparation.
A low student-to-faculty ratio ensures personalized instruction, mentorship and meaningful professional relationships that last long after graduation.
From the first semester, UWL PT students engage in hands-on learning through coursework, labs, clinical experiences and community-based activities. UWL’s early immersion model allows students to practice skills in clinical-style environments before entering hospitals or clinics — building confidence and competence in low-risk, high-impact settings.
Students also design and implement community projects, planning in the fall and carrying them out in the spring. These experiences serve diverse populations from pediatrics to older adults and those with and without physical or intellectual disabilities.
Signature programs and partnerships in past years have included:
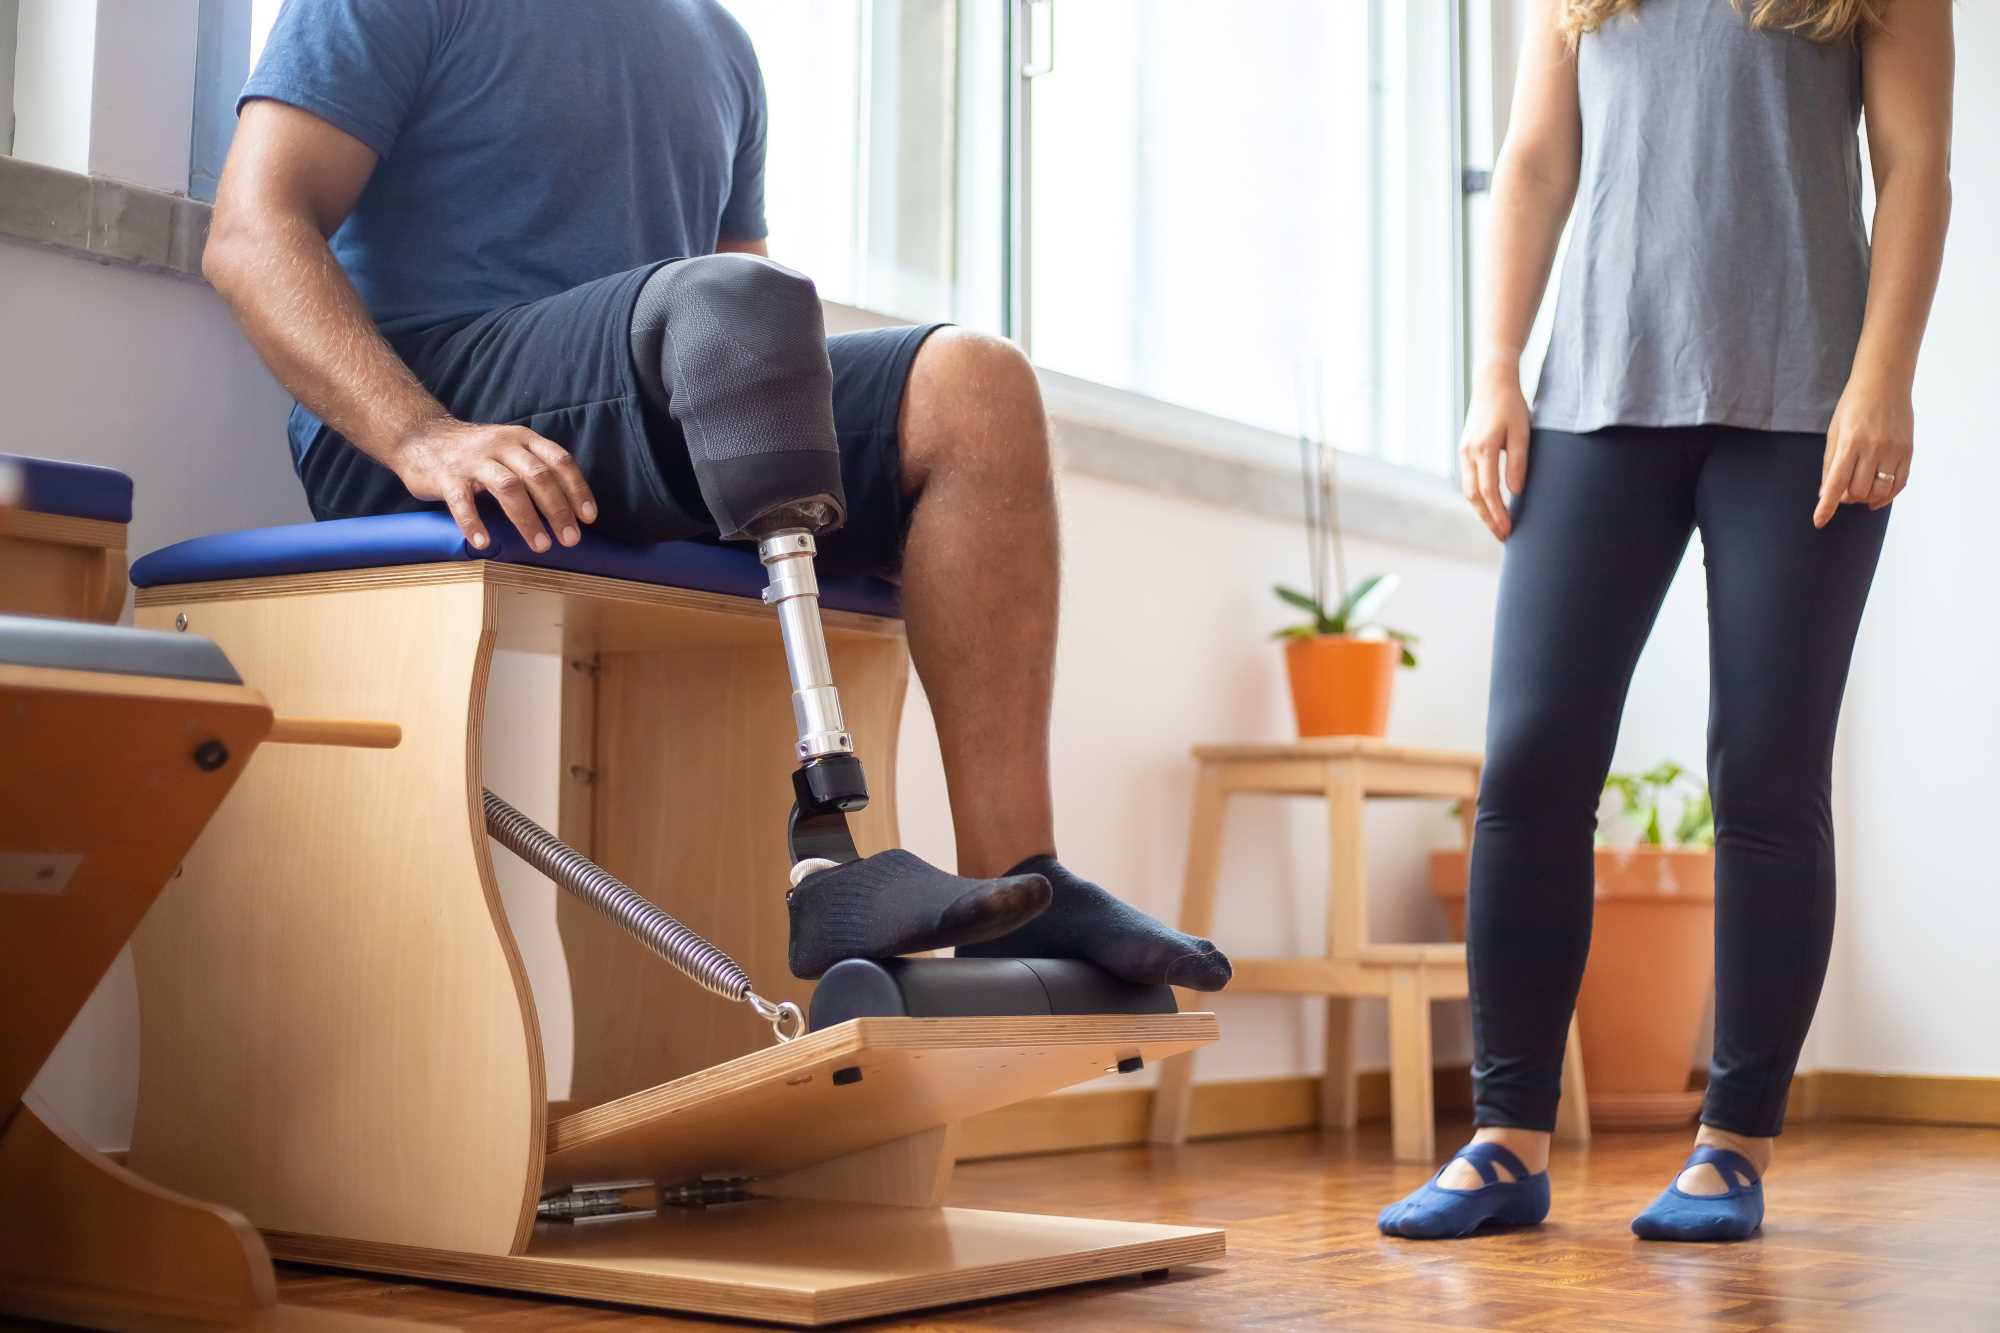
- LEAP (Lower Extremity Amputee Program)
Students develop and lead individualized walking, balance and strengthening programs for individuals with lower extremity amputations, tracking progress and providing hands-on support. - EXPAND (Exercise Program for Adults with Neurologic Disorders)
This program connects PT education with community need, helping adults with neurological conditions improve health, mobility and overall wellness. - Special Olympics SoFit
Students work with Special Olympics athletes through bi-weekly strength and conditioning sessions. - APTIV
Students support movement-based programming—including cardiovascular, strength and coordination activities—for both adult and pediatric participants. - Boys & Girls Club
Students serve as mentors while leading movement-based programming for adolescents. - La Crosse County Department of Disability & Aging
Students provide cognitive and fall-risk screenings for community members. - RealGirls
Students contribute to this local mentoring and running program for 4th- and 5th-grade girls. - Eagle Crest North
Students lead exercise programming for residents in an assisted living setting. - Community Wellness Program
Students design fitness programming aimed at improving overall fitness in adult participants. - Group Balance & Strengthening
Students facilitate group exercise sessions for individuals with neurological conditions.
Located in the Health Science Center (HSC), PT students learn alongside peers in other health professions, promoting interprofessional collaboration and research. The HSC houses:
- The La Crosse Institute of Movement Science (LIMS) is a collaborative research entity comprised of multidisciplinary labs, clinicians and scientists. It houses three primary research labs.
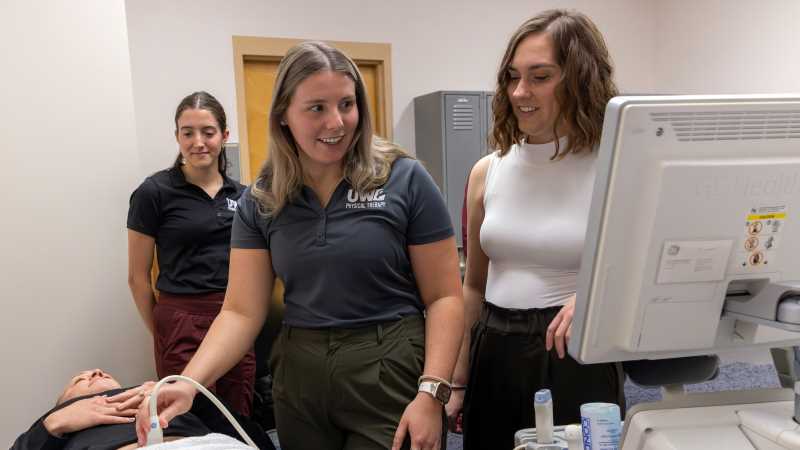
- The Enhancing Movement, Pelvic Outcomes, and Wellness Research (EMPOWER) Lab focuses on improving lifespan health by studying the intersection of pelvic health, physical activity and longevity. Research in this lab centers around three major lifespan transitions: adolescence, matrescence and menopause. State-of-the art equipment includes metabolic carts, a DEXA scanner, ultrasound imaging machines and EMG/biofeedback. Students at both the graduate and undergraduate level provide significant contributions to studies and manuscript publications in the EMPOWER Lab.
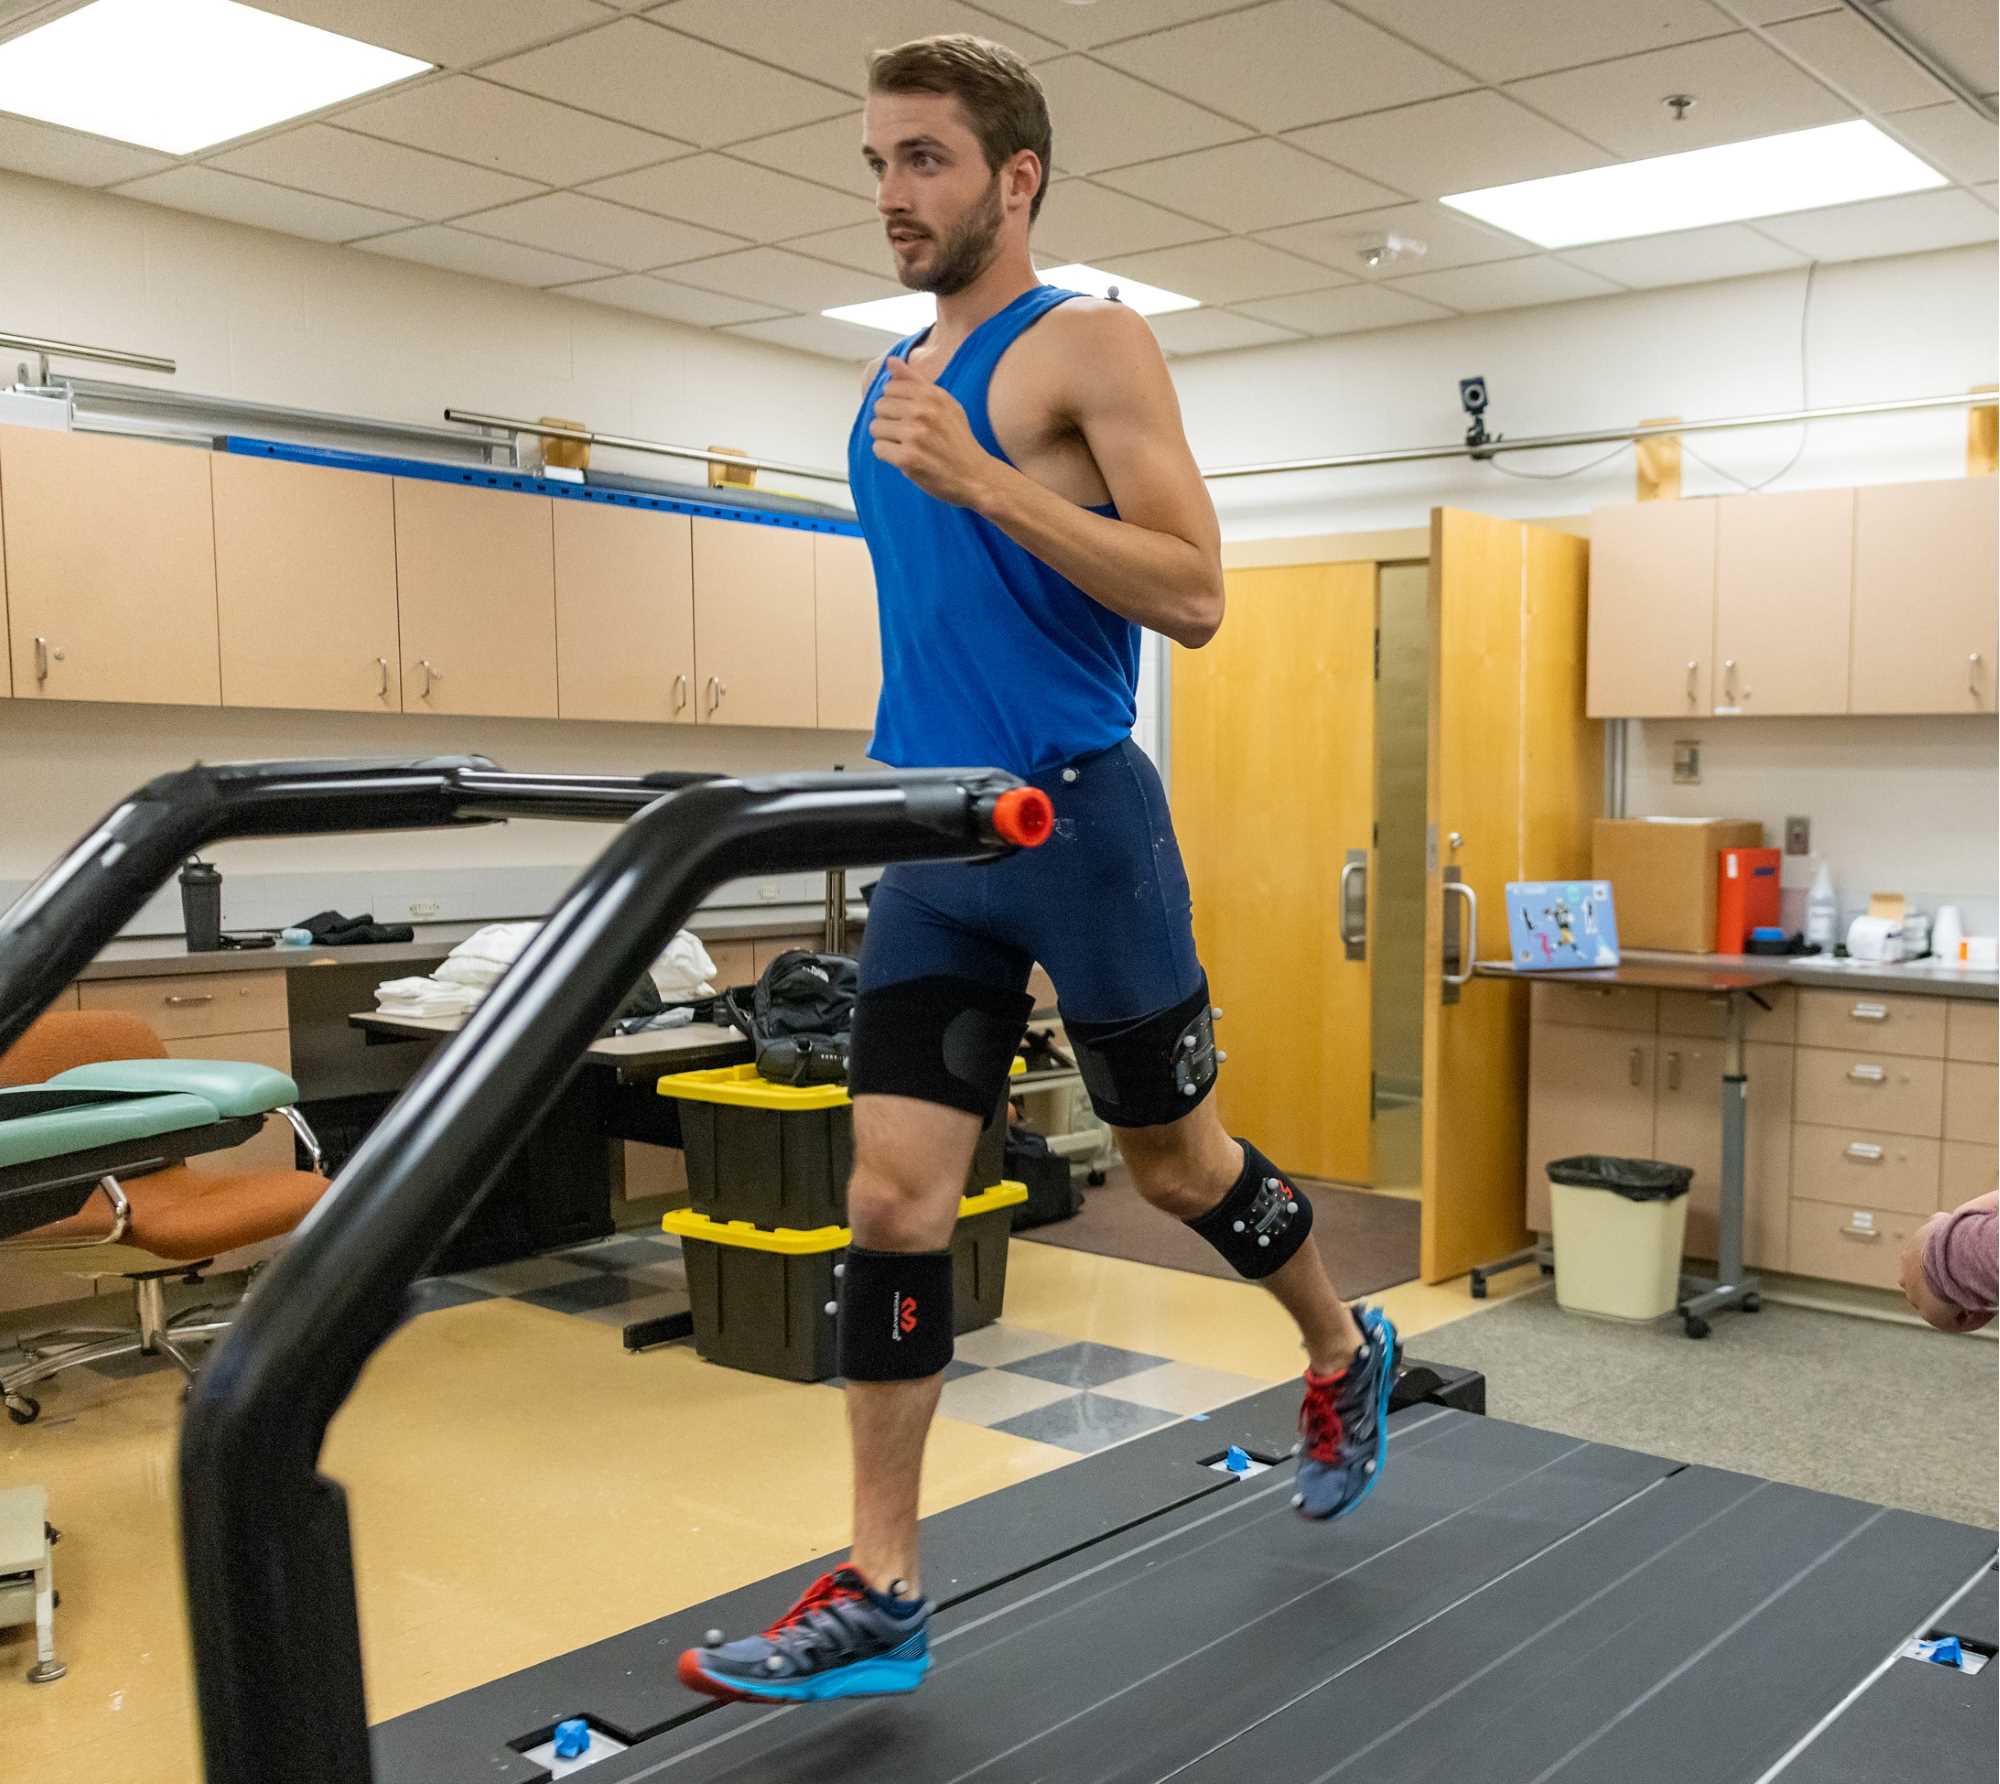
- Strzelczyk Clinical Biomechanics Laboratory focuses on biomechanics research in health and patients populations. State-of-the-art equipment includes three-dimensional motion analysis; force and pressure distribution measurement equipment; ultrasound imaging; and electromyography systems. Students at both the graduate and undergraduate level contribute to work in this prolific lab.
- The Performance Analysis for Clinical Exercise and Running Performance (PACER) lab is an additional multi-disciplinary space that houses a motion analysis system and instrumented treadmill for gait analysis and advanced biomechanics research.
- The Exercise Program for Adults with Neurologic Disorders (EXPAND) links UWL physical therapy education with a community need to provide adults with neurological disorders a place to learn how to maximize their health and wellness. The EXPAND program serves community members with Parkinson's disease, multiple sclerosis, balance disorders and those recovering from stroke or head injury.
American Physical Therapy Association
Credentialed Clinical Instructor Program Level 1
at the University of Wisconsin-La Crosse
Dates:
- Thursday, August 6, 2026 | 7:30 a.m. - 5:30 p.m.
- Friday, August 7, 2026 | 7:30 a.m. - 5:00 p.m.
Registration deadline:
- Friday, July 10, 2026
Please contact Angela Wiste at awiste@uwlax.edu or 608.785.8471 for further information.
Important dates
Applications open in mid-July, and admissions are conducted on a rolling basis. Beginning September 15, completed applications are reviewed as they are received, and interview invitations and admission offers are extended throughout the cycle until the class is full.
Because seats are filled on an ongoing basis, early application is strongly encouraged. While the final application deadline is November 1, the class may reach capacity before that date.
Applicants will be notified of admission on an ongoing basis beginning in late September.
Latest news
Hear from an alum
Katie Hall, '26
The UW–La Crosse Doctor of Physical Therapy Program truly embodies a “work hard, play hard” ethos. The tight-knit community, supportive faculty, and focus on academic rigor, research, and service have made my last three years here incredibly rewarding both personally and professionally!
Hear from an alum
Kayla Lass, '26
The UW–La Crosse Physical Therapy program stands out for its mentorship and community. Professors truly invest in you as a person, creating lifelong mentors. Through research, national conferences, leadership opportunities, and diverse clinical rotations, the program prepares students to become well-rounded clinicians.

Hear from an alum
Grace Rudek, '26
UWL PT’s people set it apart. The faculty support your growth through mentorship in coursework, research opportunities, and hands-on experiences. This same support modeled by the faculty is reflected in the student community. Classmates challenge you, empower you, and grow alongside you in the journey to become a thoughtful clinician.
Hear from an alum
Seth Polfus, '25
I believe the high-level education across disciplines makes the program stand out. Working now in a rural setting I see a little bit of everything, and coming out of school I felt prepared to provide quality care to whoever walked in the door, regardless of diagnosis.

Hear from an alum
Makenna Carpenter, '26
The Physical Therapy program provides a truly authentic learning experience with a strong curriculum and diverse clinical and research opportunities. Faculty genuinely invest in students as both learners and individuals, fostering meaningful relationships beyond the classroom, while building a solid foundation for continued growth as clinicians.