
Posted 3:20 p.m. Friday, Dec. 5, 2025
Students explore commerce, data center suitability, wildlife protection and other real-world questions through GIS
Making a map isn’t just about marking locations on the Earth — it’s about uncovering the stories behind data and patterns that can ultimately help communities make informed decisions.
This semester, UWL geography and environmental science students did exactly that. Through their Geographic Information Systems (GIS) coursework, they created maps that tackle real-world issues ranging from wildlife conservation to data center expansion.
On Friday, Dec. 5, students showcased their projects during the department’s first-ever reverse career fair — an event where employers visit students at their project displays rather than the other way around. The format gave students a chance to share their skills directly with professionals and demonstrate how GIS tools can translate classroom knowledge into meaningful, applied work.
Finding the next Trader Joe’s?
UWL students Claire Rolbiecki and Melanie Weis brought together their love of Trader Joe’s and their GIS skills to answer a question they and likely other Wisconsinites want to know: Where should the next Trader Joe’s go — La Crosse or Appleton?
Using ArcGIS Pro, they mapped commercial zones and analyzed socio-economic factors that influence successful retail locations. Their multicriteria spatial analysis ultimately showed that La Crosse is slightly better suited for a potential Trader Joe’s.
“I learned in-depth knowledge of ArcGIS Pro and Adobe Illustrator, strengthened my work ethic, and deepened my understanding of the variables and patterns behind retail location decisions,” says Rolbiecki.
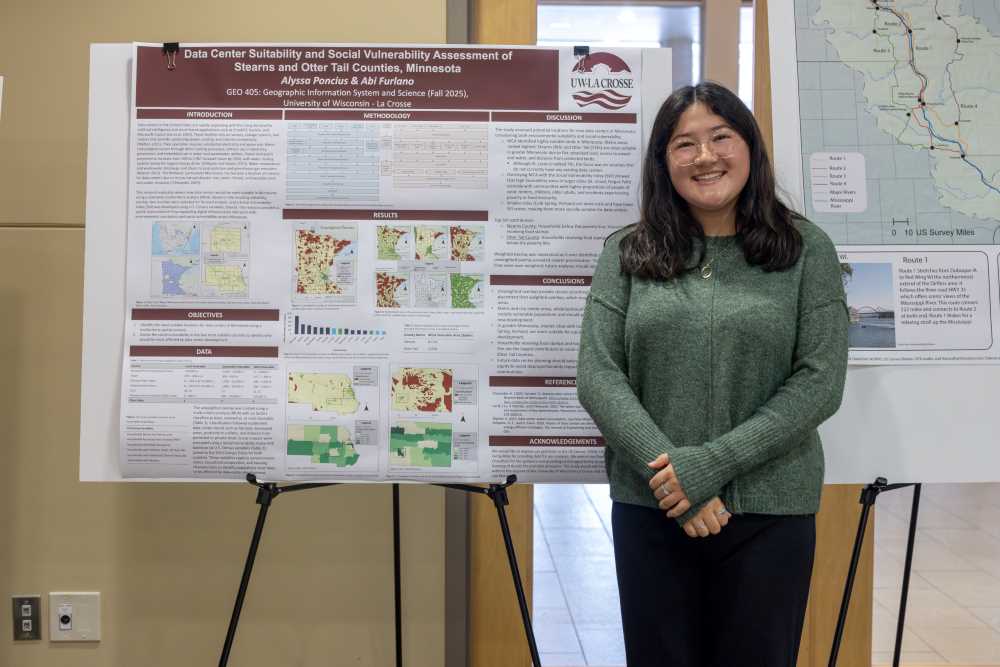
Data center suitability in Minnesota
As the Midwest becomes a hub for data centers — infrastructure supporting everything from cloud computing to artificial intelligence — understanding where to place these facilities is increasingly important.
Senior Alyssa Poncius and classmate Abi Furlano mapped statewide suitability for data centers in Minnesota, then examined the social vulnerability of communities in the two most suitable counties: Stearns and Otter Tail. While the Twin Cities area is already well positioned for development, the pair wanted to see how data center growth might play out in greater Minnesota.
They incorporated factors such as distance to power lines and water, land use and slope to identify favorable development areas. They also used census data to assess household characteristics including poverty, renter status, age and race.
Their findings showed that the most suitable areas were often in city centers with higher social vulnerability, while rural areas sometimes provided lower-vulnerability options — insights that could help guide more equitable development.
“Mapping and GIS skills are central to environmental science and conservation,” says Poncius. “These tools help connect ecological data with social and community information. They allow us to create clear visual explanations and interpretations of climate change, environmental pressures, and human impacts."
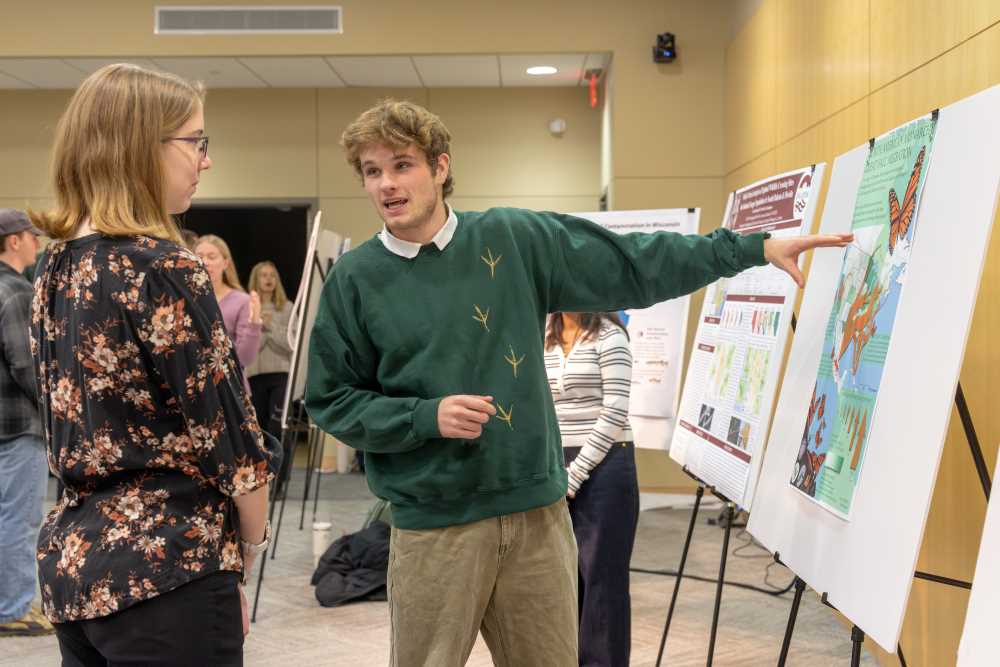
Protecting cougar populations through wildlife crossings
Juniors Finn Patenaude and Swasthika Selvakumar focused their project on wildlife conservation, mapping optimal sites for wildlife crossings that could help protect two isolated North American cougar populations threatened by human activity. Their analysis centered on two parks where vehicle collisions are common — Black Hills National Forest and Big Cypress National Preserve — and combines variables such as road presence, cougar mortality, and land use/land cover to identify viable crossing locations. Using Google Earth, they identified 12 crossing sites across both parks that already exist, suggesting that their methodology and selected variables are aligned with real-world infrastructure planning and conservation efforts.
“The combination of complex pieces of data across geographical space gives us a rare perspective that makes difficult questions legible, approachable and provides genuinely applicable solutions,” says Patenaude.
Mapping skills that matter to employers
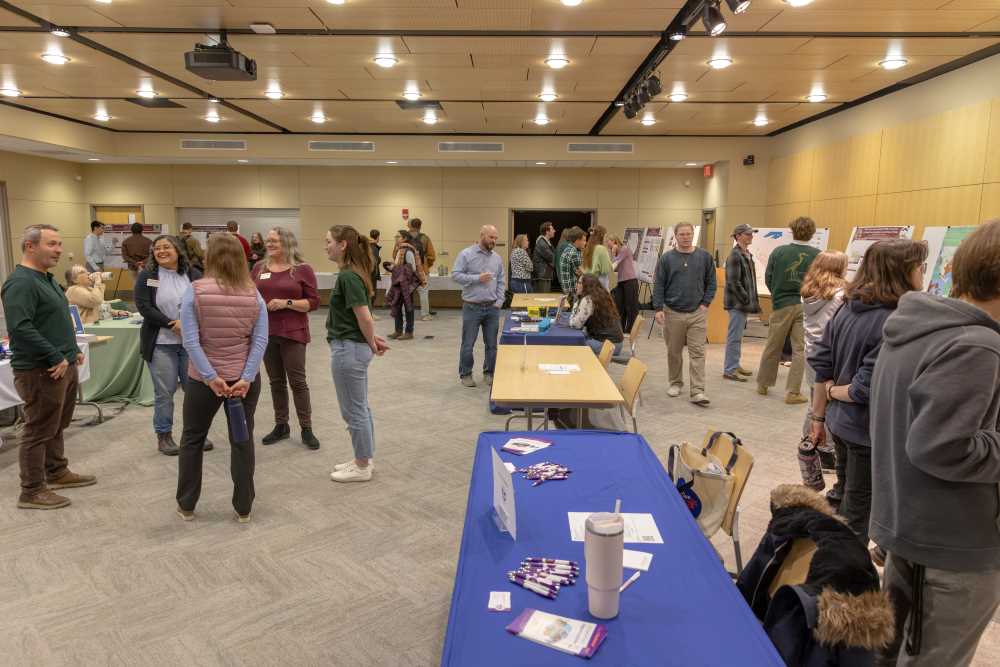
For students, presenting at the reverse career fair allowed them to discuss topics they care about and show how GIS can turn complicated data into practical solutions.
The event also gave employers a firsthand look at both the technical abilities students are building — such as ArcGIS Pro proficiency — and the essential skills they are practicing, including teamwork, communication and presenting information clearly.
“It’s a chance to show that we can move from classroom knowledge to applied work — identifying a research question, gathering and analyzing data, and communicating results in a meaningful way,” says Poncius. “The experience helps build local connections and gives employers a sense of how I would contribute in a professional setting.”