Physician Assistant Studies
Admission data
| Characteristic | Class of 2027 (matriculating May 2025) |
|
Casper Z Score (range) |
1.02 (-0.35 - 2.48) |
| Mean Cumulative GPA (range) |
3.90 (3.76 - 4.00) |
|
Mean Science GPA (range) |
3.86 (3.57 - 4.00) |
|
Mean Age at Application (range) |
21.9 (20 - 30) |
|
Mean Patient Care Experience Hours (range) |
2030 (0 - 9840) |
| Class of |
CASPA Applications |
Students Interviewed |
Students Admitted | Average Cumulative GPA | Average Science GPA |
| 2027 | 628 | 90 | 28 | 3.90 | 3.86 |
| 2026 | 499 | 90 | 28 | 3.91 | 3.89 |
| 2025 | 418 | 90 | 28 | 3.90 | 3.87 |
| 2024 | 491 | 90 | 28 | 3.92 | 3.90 |
| 2023 | 492 | 90 | 28 | 3.92 | 3.89 |
| 2022 | 413 | 90 | 28 | 3.87 | 3.86 |
| 2021 | 416 | 90 | 28 | 3.89 | 3.86 |
| 2020 | 397 | 72 | 25 | 3.91 | 3.89 |
| 2019 | 373 | 60 | 19 | 3.88 | 3.83 |
| 2018 | 354 | 60 | 19 | 3.87 | 3.87 |
| 2017 | 319 | 60 | 19 | 3.90 | 3.87 |
| 2016 | 421 | 60 | 19 | 3.87 | 3.86 |
| 2015 | 374 | 60 | 19 | 3.89 | 3.88 |
| 2014 | 336 | 60 | 19 | 3.86 | 3.85 |
| 2013 | 326 | 60 | 19 | 3.79 | 3.77 |
| 2012 | 285 | 60 | 19 | 3.82 | 3.81 |
| 2011 | 226 | 60 | 14 | 3.80 | 3.80 |
| 2010 | 197 | 60 | 14 | 3.79 | 3.73 |
| 2009 | 168 | 60 | 14 | 3.78 | 3.68 |
| 2008 | 165 | 60 | 14 | 3.66 | 3.51 |
Health professions news feed
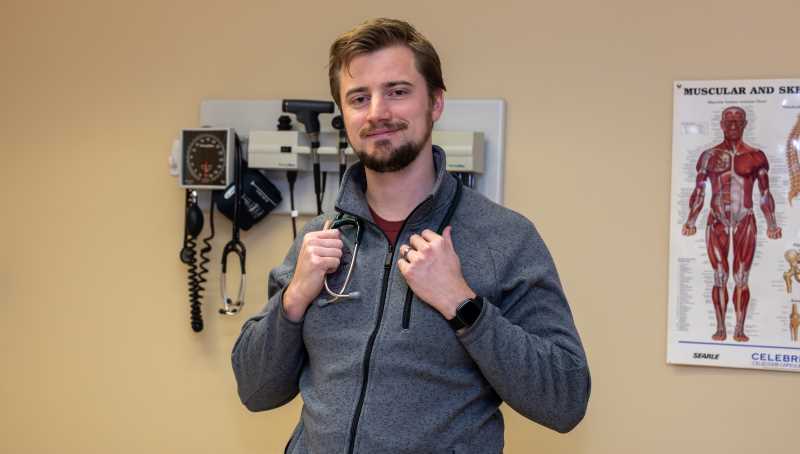 Expanding his scope
Posted 9:50 a.m. Wednesday, Jan. 14, 2026
UWL student returns to grad school, expanding his role in patient care
Read more about Expanding his scope
Expanding his scope
Posted 9:50 a.m. Wednesday, Jan. 14, 2026
UWL student returns to grad school, expanding his role in patient care
Read more about Expanding his scope
 Saying more with less
Posted 2:30 p.m. Thursday, Dec. 11, 2025
Say it in 6 competition challenges grad students to rethink communication, reflect on growth
Read more about Saying more with less
Saying more with less
Posted 2:30 p.m. Thursday, Dec. 11, 2025
Say it in 6 competition challenges grad students to rethink communication, reflect on growth
Read more about Saying more with less
 How to use AI to refine your resume
Posted 9:58 a.m. Friday, Oct. 24, 2025
Learn to use online tools to tailor, refine and perfect your resume
Read more about How to use AI to refine your resume
How to use AI to refine your resume
Posted 9:58 a.m. Friday, Oct. 24, 2025
Learn to use online tools to tailor, refine and perfect your resume
Read more about How to use AI to refine your resume
 Returning to their roots
Posted 12:20 p.m. Thursday, Oct. 23, 2025
Alumni physicians give back through UWL’s Physician Assistant Studies program
Read more about Returning to their roots
Returning to their roots
Posted 12:20 p.m. Thursday, Oct. 23, 2025
Alumni physicians give back through UWL’s Physician Assistant Studies program
Read more about Returning to their roots
 Leading in health professions
Posted 3:23 p.m. Thursday, Oct. 2, 2025
UWL health programs see continual growth, top-tier outcomes and direct pipelines to employment
Read more about Leading in health professions
Leading in health professions
Posted 3:23 p.m. Thursday, Oct. 2, 2025
UWL health programs see continual growth, top-tier outcomes and direct pipelines to employment
Read more about Leading in health professions